Credit Union ALM Manager
Credit Union ALM Manager (CUALM) is the industry’s most effective and efficient asset-liability, profitability, and risk management platform. CUALM’s computation engine has been used by large financial institutions worldwide to over two decades. CUALM provides accounting level accuracy at individual loan, deposit, and investment level. CUALM integrates seamlessly with any credit union core system within an advanced technology framework that does not require any assistance from IT resources. Onboarding takes only 10 days and once implemented data is automatically uploaded at time intervals (daily, weekly, or monthly) determined by the credit union managements and boards.
CUALM has comprehensive functionalities that reduce management workload by 60% while increasing effectiveness of strategic and tactical decisions.
Functionalities
Asset Liability ManagemenT
CUMAN Dashboard
CUALM provides a comprehensive set of functionalities for day-to-day asset-liability management with prebuilt dashboards with industry best practices. These range from asset and liability maturity management, interest rate sensitivity, funding cost analysis, interest margin analysis and projections, contingency funding, asset and liability run off, EVE analysis, and Net Interest Margin and Income
Limits Management
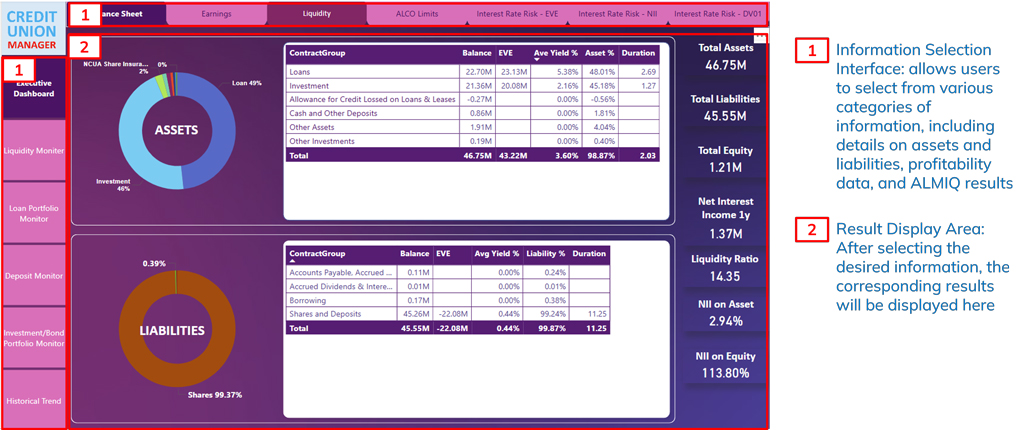
Policy Limits Dashboard
Credit Union managements find it resource-intensive to track risk and board limits on a continuous basis as advised by NCUA and State Examiners. Legacy risk systems on inefficient and disconnected technologies are generally not mapped and/or connected to core systems where deposit, loans and investment, and portfolio investment is stored and updated. This results in a cumbersome workflow that is not concurrent with inherently dynamic and constantly changing loan, deposit, and investment portfolios. Most often, limit compliance is tracked ex post – on portfolios that are one month to one quarter old. This defeats the purpose of limit monitoring and is viewed unfavorably by examiners. In addition, the outputs of risk limits are provided in print form that cannot be ported into board presentations digitally making what-if scenarios and stress tests inflexible to conduct. NCUA and State Examiners consider this framework as not following best practices.
CUMAN has addressed this issue with several innovations. Its distinguishing features are described below:
- In the implementation stage our limit specialists quantify and map the board limits into the calculation engine with applicable logic.
- Once mapped our analysts tailor the standard limit screen to conform to the specific framework to create limits dashboard. This dashboard has green, orange, and red indicators that are triggered when a limit is in good standing, approaching a breach or is breached.
- CUMAN framework is mapped to the credit union’s core system. The limit dashboard is now live and current.
- Historical limit standards and parameter values are calculated for trend analysis going as far back as 5 years. This is tracked on a regular basis with current limit values and credit union parameters.
- The limit parameters and their historical values are directly imported into Board meeting packages and Call Reports.
Greenpoint
1
Map limit logic and parameters
2
Map computation engine
3
Connect to core system
Greenpoint + Credit Union management
4
Customize limits dashboard
5
Display concurrent and historical limits
Profitability Tracking and Management
CUMAN Dashboard
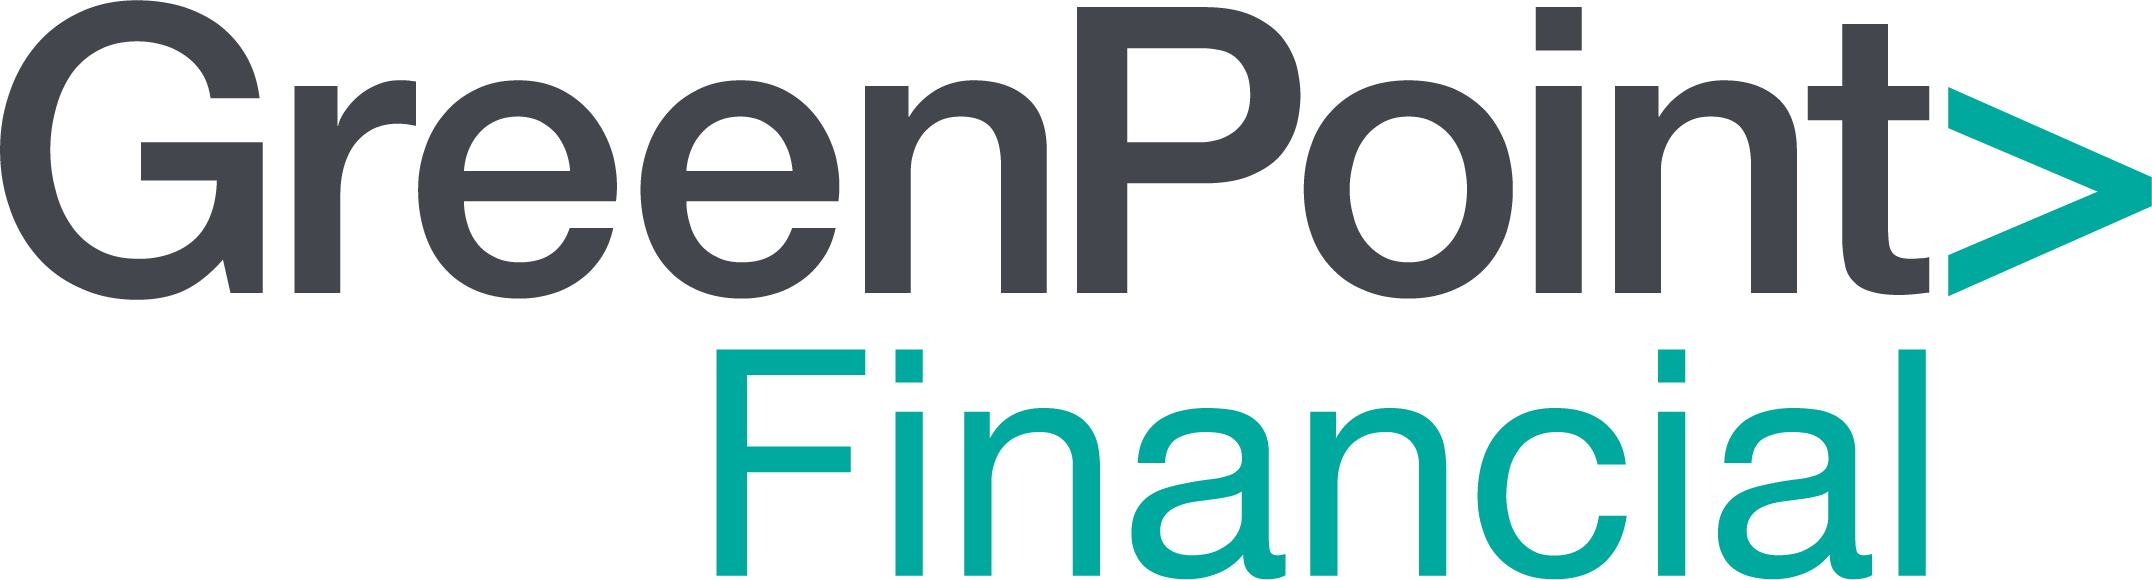
Earnings Dashboard
Earnings Dashboard
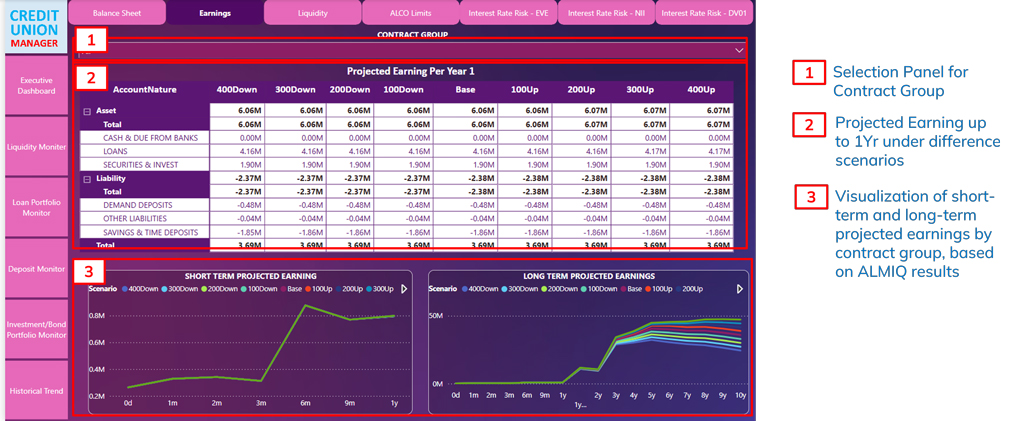
Credit Union profitability measurement has unique aspects. This is because credit unions are not run for profit maximization and shareholder value, but rather serving its members and creation a strong and stable net worth. CUMAN’s profitability measurement and tracking framework is designed from the ground up with credit union balance sheets, mission and unique aspects. CUMAN measures interest rate margin at the individual loan, deposit, and investment level, adjusts it with operational costs and credit losses, and computes return on assets (ROA), net worth ratio, and economic value of equity (EVE) and member share value created on a continuous basis.
ALCO and Board Reports
Creation of ALCO reports is a cumbersome periodic exercise for credit union managements. This takes their attention and time away from their core mission of serving members and their changing needs. Managements have to assemble ALCO reports from various data and information sources in different data formats, conform to their specific framework and then repeat this process on a regular basis.
We have created a universal ALCO report framework that follows the best practices across the industry. This format is tailored to specific credit union requirements. Managements and Board members can then focus on tactical and strategic decisions rather than shuffling through spreadsheets to find relevant information.
CUMAN System
1
Review universal ALCO and Board reporting format
2
Tailor format to institution-specific requirements
3
Export the CUMAN Report with one click
Credit Union Management
4
Make modifications to comments and explanations
5
Generate the ALCO and Board reports
6
Store reports for future reference
Risk Management
Day-to-day risk management for a credit union involves keeping track of deposit and loan rates, interest rate margins, delinquencies and defaults, Board limits, capital adequacy, regulatory requirements. Most credit unions have disparate systems for managing risks on a day-to-day basis. This can result in uninformed and suboptimal tactical decisions for rate setting and delinquency management.
Loan Portfolio Monitor Dashboard
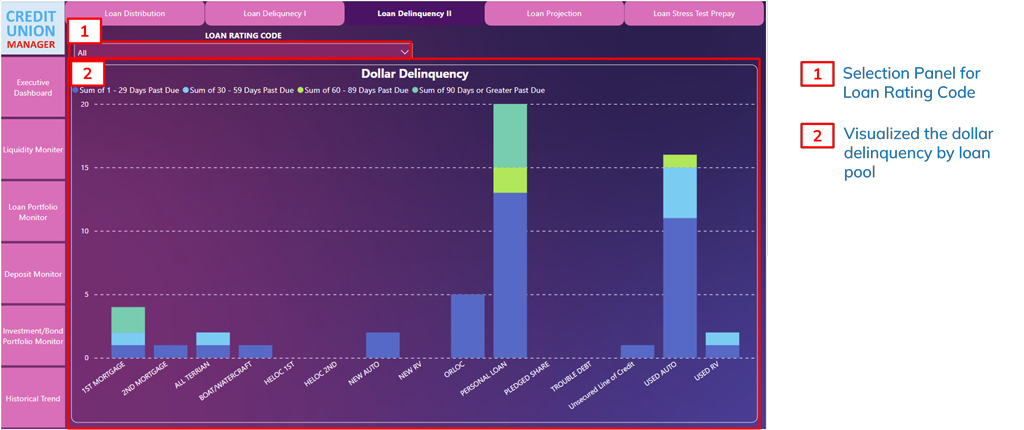
CUMAN has created a unified dashboard that aggregates all risk measures and parameters into one dashboard. All information – current and historical at individual loans and deposits is one click away. Data imports and computations are performed in the background on a daily basis. This enables managements to manage risks and take corrective actions as necessary.
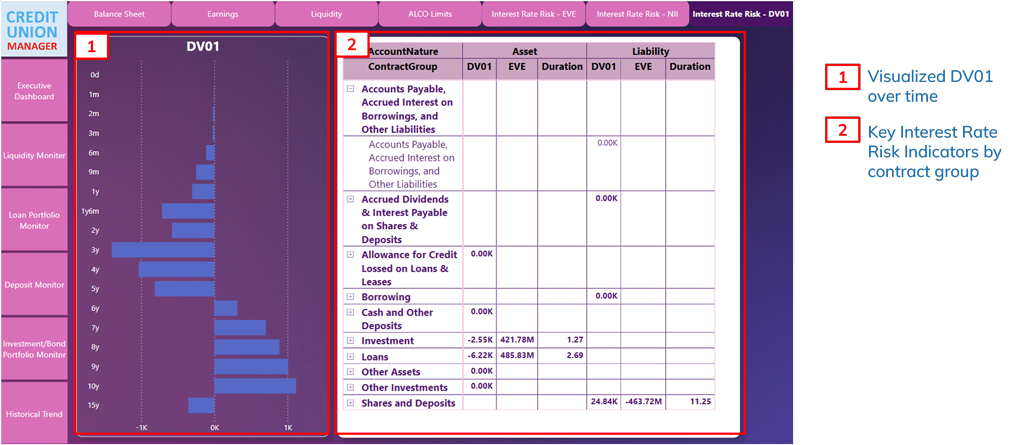
Interest Rate Risk Dashboard
Interest Rate Risk Dashboard
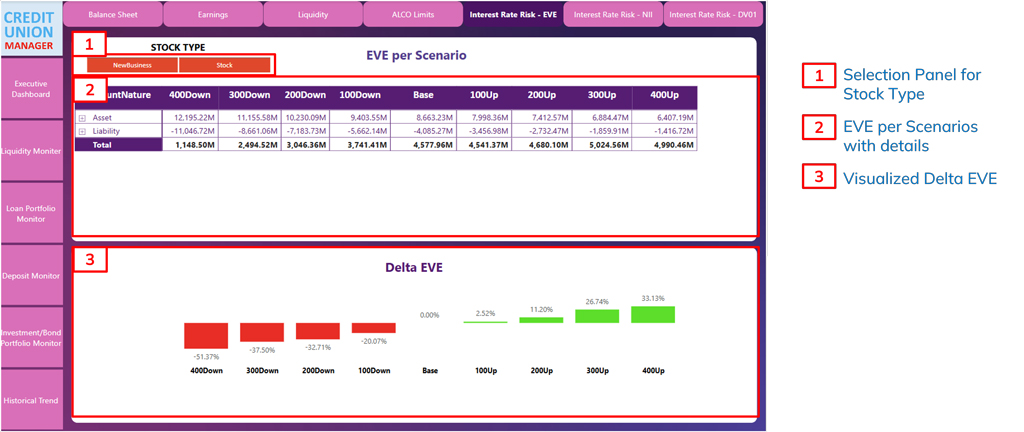
Interest Rate Risk Dashboard
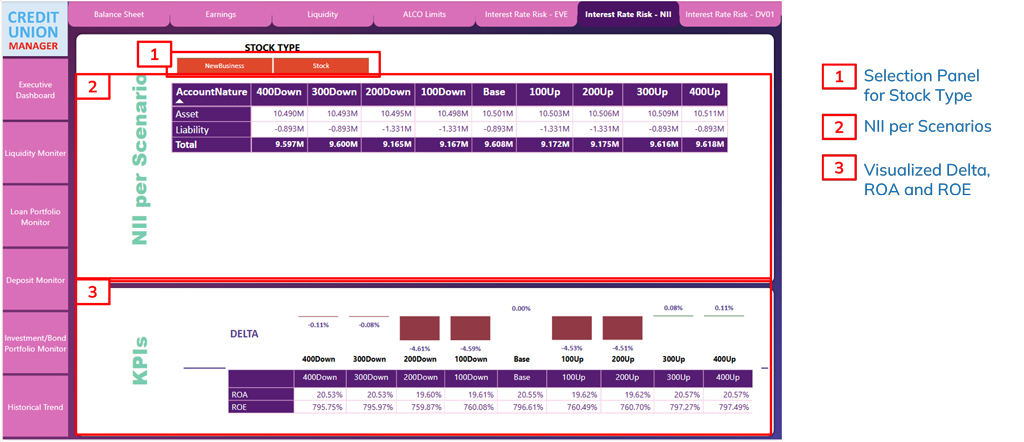
Interest Rate Risk Dashboard
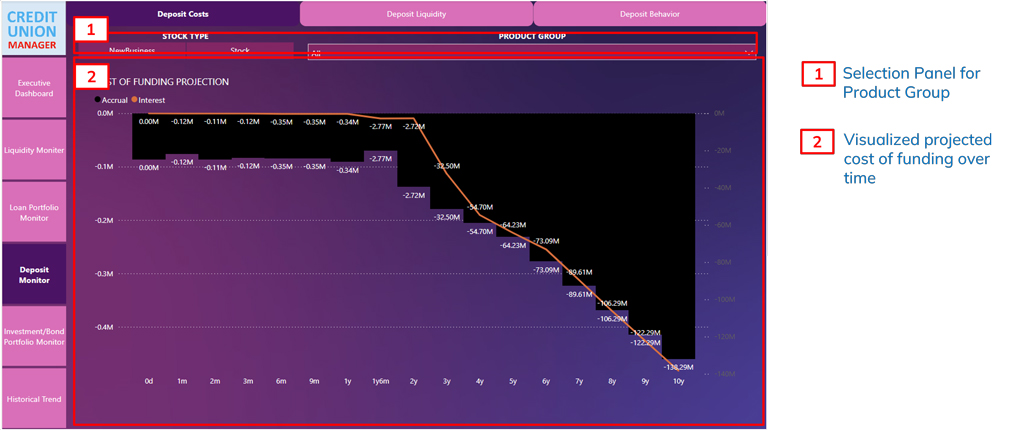
Funding Analysis
In volatile interest rate and economic environments – such as the one we are facing now – latency in setting rates can impact funding costs that result in compressed and sometimes negative margins. This impacts net income in the short and long run because operational costs are stable and cannot be reduced proactively. This can result in impact on net worth, attracting scrutiny from NCUA and state examiners and comments and warnings.
CUMAN has addressed this through a funding cost analysis framework that views short– and long-term funding cost analysis with monthly, quarterly, yearly time frames extending to 10 years. This enables accuracy in proactive rate setting and stable margins in any interest rate environment. This is further supplemented by CUMAN’s scenario planner that has flexibility to conduct any interest rate scenario, borrower and depositor behavior, and new loan and deposit origination assumptions.
1
Review existing rates and margins
2
Project to one and ten years ahead
3
Create scenarios for interest rates
4
Set rates proactively
5
Set capital targets
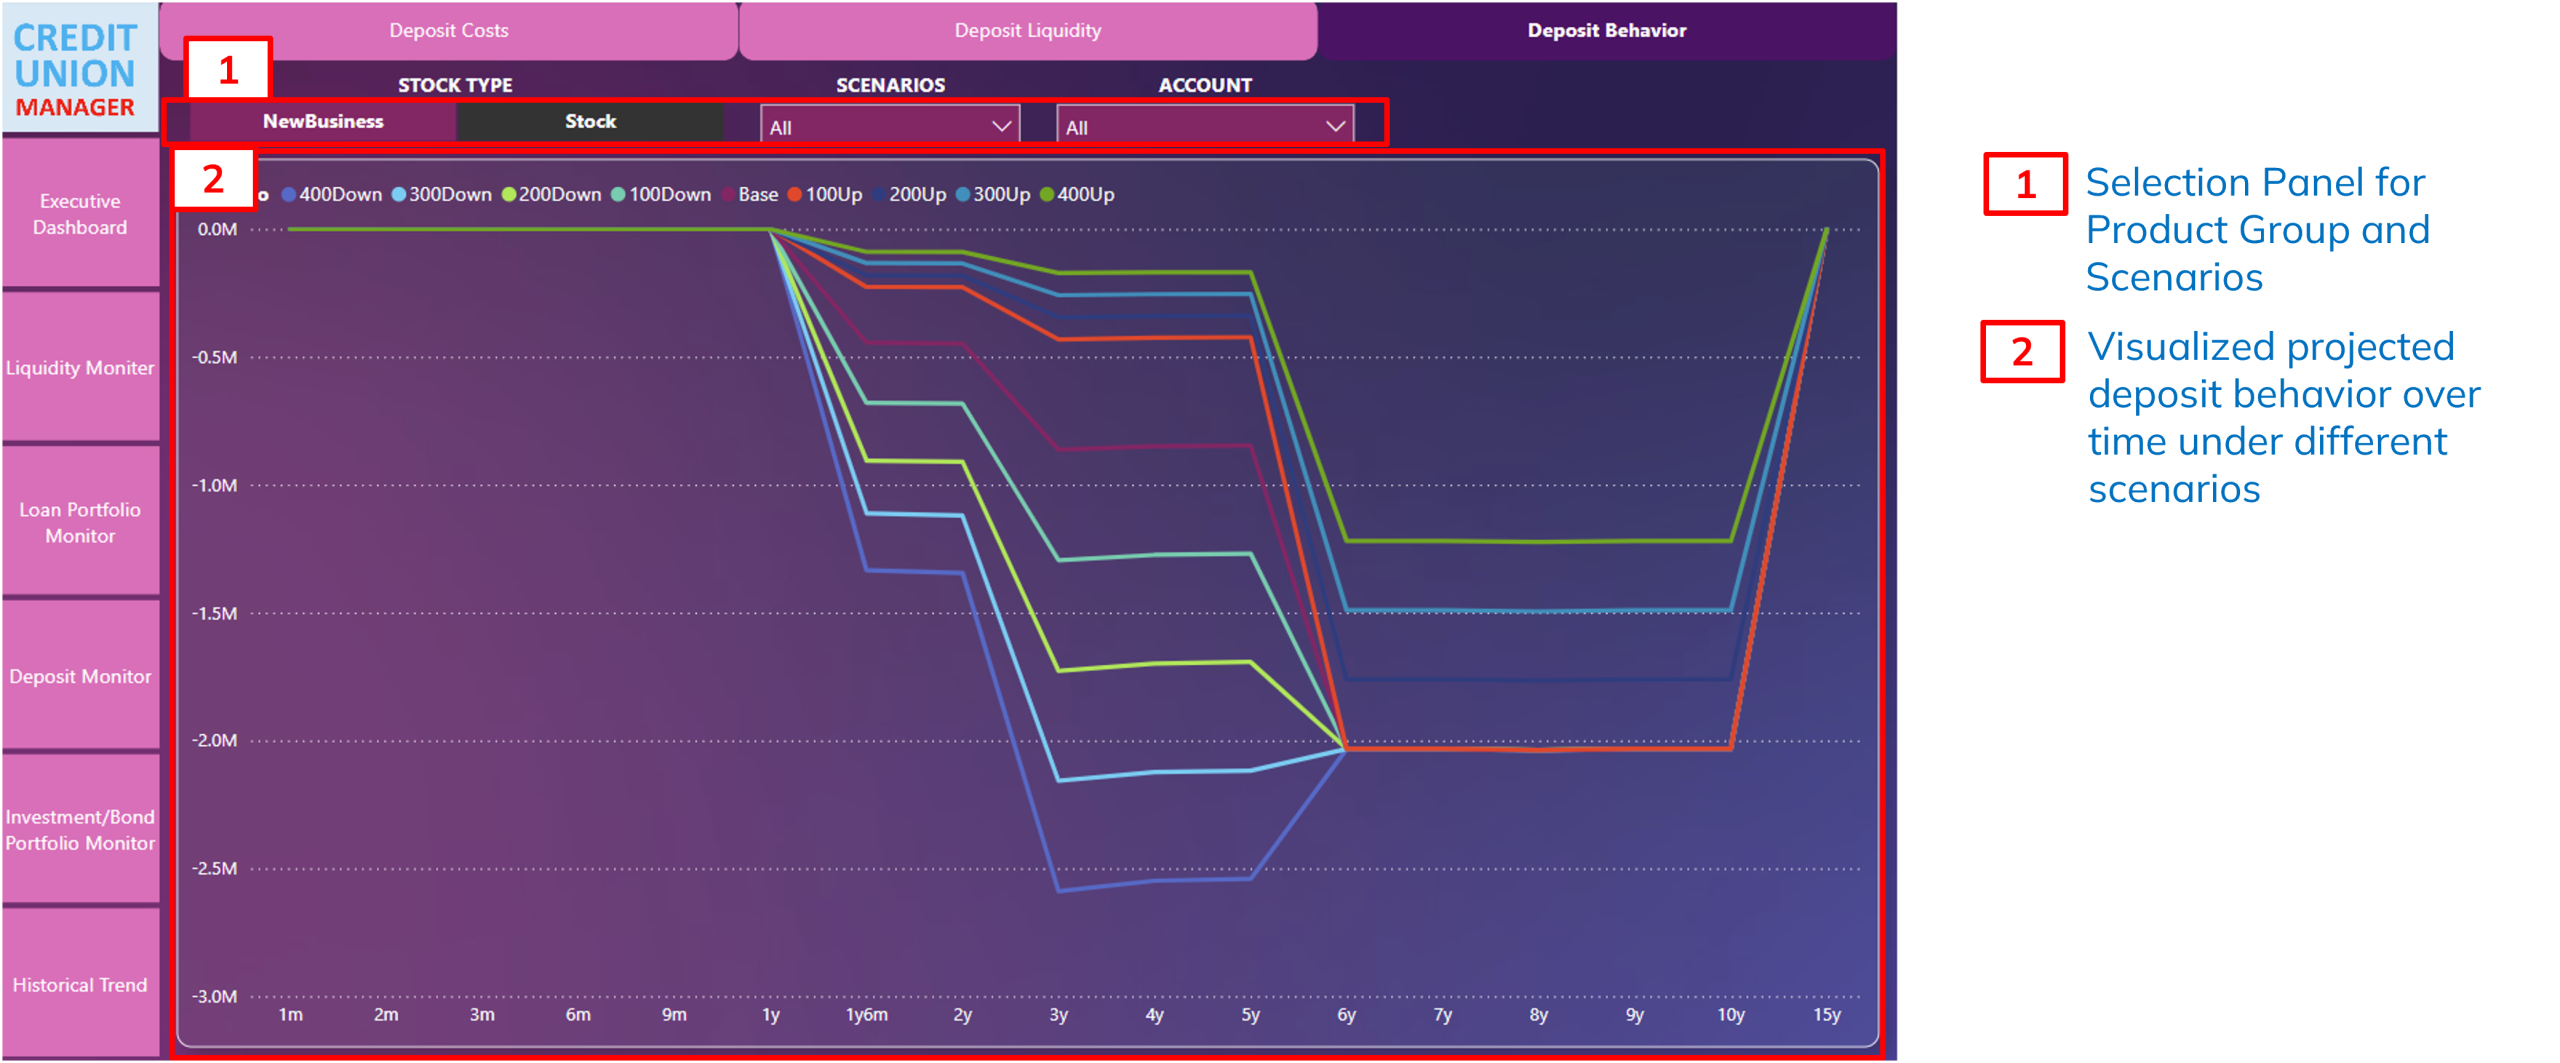
Deposit Monitor Dashboard
Deposit Monitor Dashboard
Deposit Monitor Dashboard
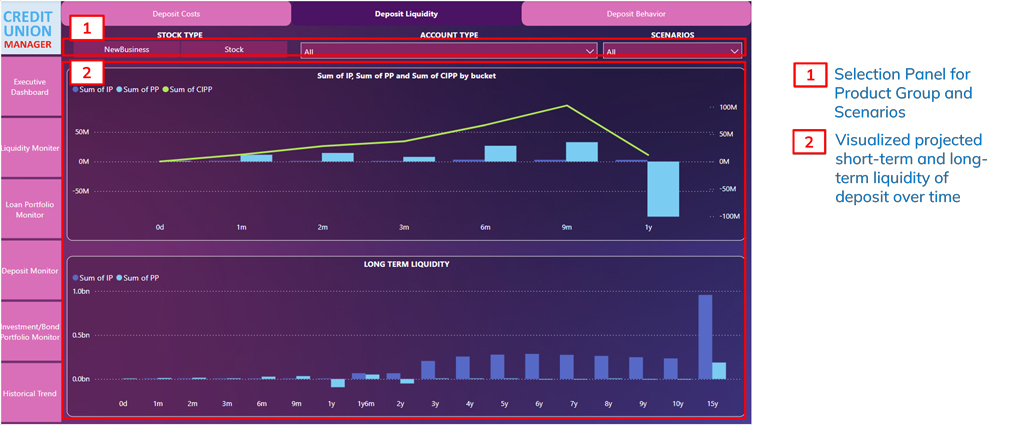
Deposit Monitor Dashboard